Is multidimensional scaling useful? The raw data form is an adjacency (discretized, usu. binary) or distance (continuous, inverted from adjacency) matrix. If we use a cluster detection algorithm on our distance matrix, we can sort it into groups and arrange the elements to relate adjacency and closeness on the axes. Here we have one such sorted adjacency matrix by Mike Bostock on the co-occurrence of characters in Les Miserables.
 |
| http://bost.ocks.org/mike/miserables/ |
With fewer than 100 elements, this approach can work well. We can recognize the existence of clusters in the data, and begin to look between clusters if there are concentrations of adjacency or low-distance off the major diagonal. The cluster detection algorithm sorts the character Valjean into the green group, but we can recognize a concentration through him with the purple group. Several characters in the yellow group also have relation to the purple group. These concentrations will likely be sparse in most data sets, so this method of finding relations between clusters should hold up well. Between 100 to ~500 elements this matrix display could still work, but should make use of shading and blurring rather than discrete boxes to preserve space.
Could we map from the values of an adjacency matrix to Euclidean distances of element on a graph, a preserve the information we have? Properly, no. We lose information because the system is overconstrained by the distances between all of the elements. We only preserve clusters, and a binary form of close v. far. With many classes (clusters that should arise), and many features, the probability of high 'tension' or poor solubility of the mapping to distances on the embedding grows. This tension happens when an element or cluster both pushes and pulls from different elements in another cluster. Compression of a distances in N-dimensional space to two dimensional space necessarily loses information. In practice, we can not learn useful information between different values of 'far', only if a pair is close or far. Does this hold up?
Here, we show the same data as above, in another visualization by Mike Bostock, called a Force Graph, which is a form of multidimensional scaling. Unfortunately, it appears that the clusters have different color labels.
 |
| http://bl.ocks.org/mbostock/4062045 |
What useful information can be gathered here? With a mouse-over labeling of the characters, we might learn a bit more, but this is too cluttered. Before, I had the impression that the data was fairly sparse, but from the nest of lines, whose shades should convey force information, I might think differently.
There is another multidimensional scaling algorithm in recent interest especially for model introspection in neural networks: tSNE (t-Distributed Stochastic Neighbor Embedding). First, we'll look at a map of the closeness of different forums on reddit (subreddits) based on common subscriptions.
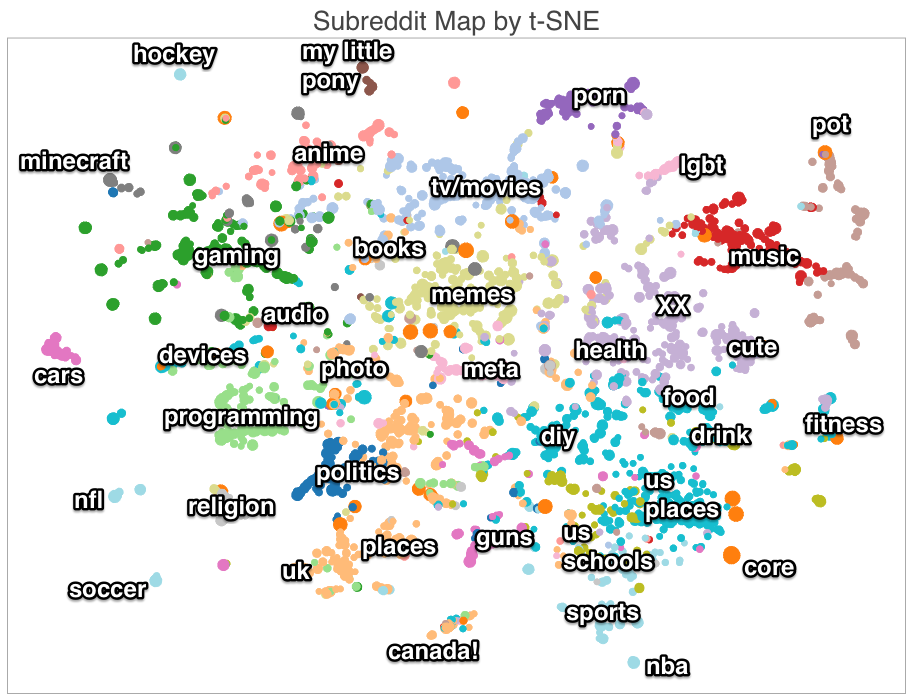 |
| http://nicolas.kruchten.com/content/2014/12/subreddit-map/ |
Next, a visualization of the MNIST handwritten digits data set.
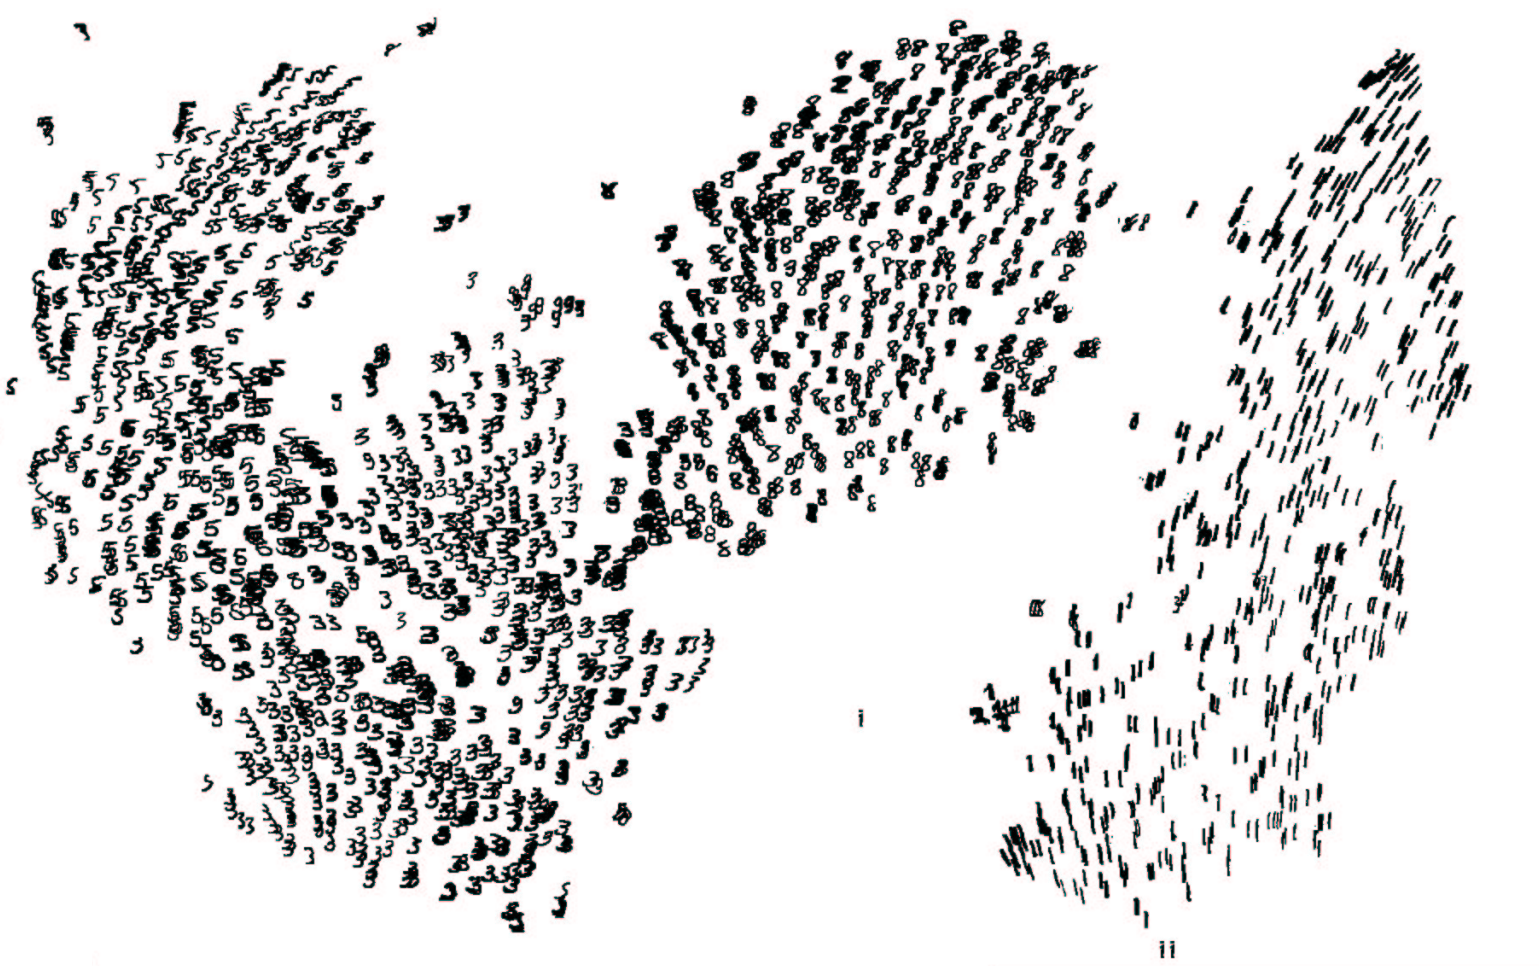 |
| http://colah.github.io/posts/2015-01-Visualizing-Representations/ |
This is a topic I'd like to revisit with other data sets, but wanted to make a first pass here.
No comments:
Post a Comment